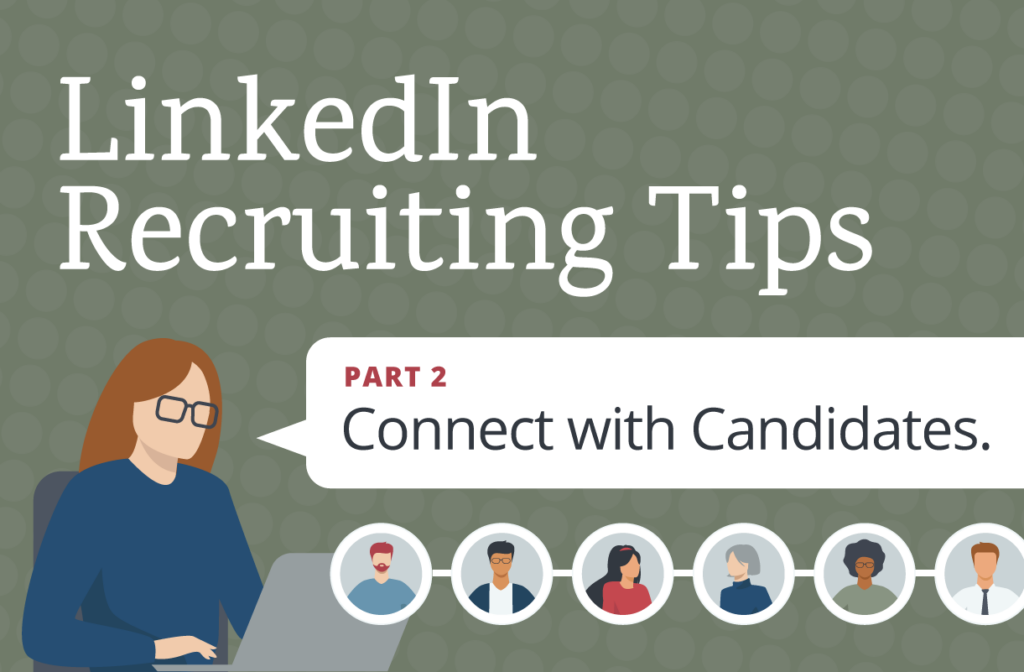
Grab your tools…it’s time to update!
Greetings from Dataspace!
Here’s hoping that this week’s newsletter finds you well, and that those of you who observe enjoyed Happy Passover and Easter celebrations, even if the family was only able to come together virtually.
Much like the above painting of the Last Supper received a recent renovation to fit in with modern times, the Dataspace team has been working on some updates of our own this past week – including a redesign of our website! We’re pretty happy with our new look, so check it out when you have a minute and let us know what you think!
Time for Homeschool: Data Science Learning Resources
This week’s online learning resources focus more on introductions to some specific analytics related tools, and ways that you can beef up your hands-on skills to tackle all of those pesky data science projects and stay up to date on the latest techniques.
Happy Learning!
- Want to get over a fear of snakes? This intro course takes the scary out of learning Python for data science.
- But how do I learn to be a real snake charmer? Once you’ve passed the python basics, expand your capacity to use this tool by introducing yourself to some of the most useful python libraries for data scientists.
- I’m more of a super nerd than a snake charmer… where should I start? Good news! Hadley Wickham – well known statistician and developer of numerous R packages – has many books and open source code to get you up and running with R programming. In particular, check out his intro books R for Data Science, and R Packages (how to develop your own!).
- My office isn’t ready for R and Python level analytics, are there some skills I can work on? This free course on data manipulation and analytics techniques for Google Sheets will help you become a formula master in 30 days! This site also has paid courses available as well, if you are interested in delving deeper into this tool.
Stay tuned next week for more learning at home resources – next time linking you to some interesting data sets you can try out your new skills on.
Ben’s Take
Howdy from my coronavirus cave (actually guest room) here in Ann Arbor!
I’m continuing work on the data matching project I mentioned last week – it’s nice to be able to focus on something purely technical for a while. More on this project as it evolves over the next few weeks and months. Please do reach out if you have a need that entails matching up records from disparate databases and spreadsheets.
New website: Our team has built a new dataspace.com website from scratch. It’s a refreshing change! Check it out if you get a moment and let me know what you think.
Bad marketing swag idea #1: Dataspace branded N95 masks. I think that’s enough said about that.
A Cool application of image recognition and data visualization: Finally, it turns out that I’m not the only one in Ann Arbor who’s working through this crisis. A local company called Voxel51 has developed technology that monitors activity in real time. Using video feeds from around the world they’re calculating a Physical Distancing Index (PDI) for each location to determine how well these cities are managing social distancing. They then plot the PDI versus the number of Covid-19 cases and deaths in each of these cities. It’s a fascinating, timely application of data science techniques to today’s biggest problem. Check it out here: https://pdi.voxel51.com/newyork. Hover over the graph to see an image from the related point in time and how Voxel51’s technology identifies the items in that image. Very cool!
Stay safe and, as always, feel free to reach out. I’d love to hear from you!
-Ben
Suggestions?
What do you think? How can we make this newsletter more useful to you? What topics would you like to see more of? Want to contribute an article? Just want to catch up and chat?
I’d love to hear from you! Email me at benjamin.taub@dataspace.com.